What Are AEO Micro‑Interaction Signals?
One often hears SEO gurus brag about backlinks, but they forget the tiny gestures users make on a page. Those gestures—hovering over a button, scrolling a fraction, or pausing on a tooltip—are called AEO micro‑interaction signals.
They feed Answer Engine algorithms the same way a heartbeat feeds a doctor: subtle, continuous, and surprisingly diagnostic.
Why AEO Cares About the Little Things
Answer Engines like Google’s “Helpful Content” update treat user satisfaction as a data point, not a feeling. When a visitor lingers on a FAQ accordion, the engine interprets that as relevance, boosting the page’s AEO score.
In short, micro‑interactions are the silent ranking levers that most competitors ignore.
Key Types of Micro‑Interaction Signals
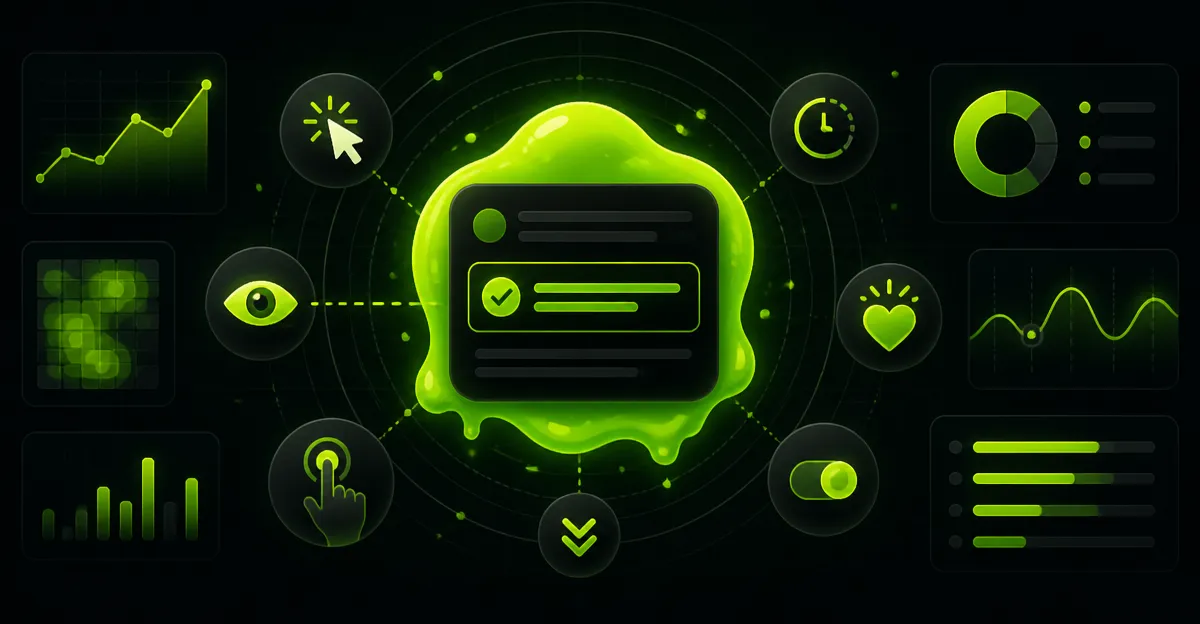
There are four signal families that dominate the AEO landscape. Each family maps to a distinct user intent and can be measured with modern analytics stacks.
1. Hover & Tooltip Engagement
When a user hovers over a term and a tooltip appears, the engine logs a “hover time” metric. Longer hovers usually mean the content is confusing or valuable—both are ranking clues.
2. Scroll Depth & Pause Points
Scrolling past the fold is easy; pausing halfway is not. Pause points signal that the reader found something worth digesting, and AEO rewards that signal with higher visibility.
3. Click‑through Confirmation
Buttons that trigger a modal, a “Read More” link, or a quick‑add to cart generate a click‑through confirmation signal. The engine sees that the user took an extra step, indicating intent.
4. Form Field Interaction
Even typing a single character in a search box counts. It tells the engine that the visitor is actively seeking information, which can boost the page’s GEO‑personalized ranking.
Step‑by‑Step: Tracking Micro‑Interaction Signals
One can’t optimize what one can’t measure, so let’s break down the tracking workflow. Follow these steps, and you’ll stop guessing and start crushing competitors.
- Deploy a tag manager (Google Tag Manager or Adobe Launch) and create a custom event for each interaction type.
- Attach the event to the DOM element using JavaScript listeners:
element.addEventListener('mouseenter', …)for hover,scrolllistener for depth, etc. - Send the event payload to your analytics platform (GA4, Mixpanel, or an llm‑enhanced data lake) with parameters like
event_category,event_action, andvaluefor duration. - Validate data in real‑time dashboards; look for outliers and drop‑off patterns.
- Map the cleaned data to AEO‑relevant KPIs: average hover time, scroll‑pause ratio, click‑through rate, and form‑field engagement score.
Analyzing the Signals: From Raw Data to Actionable Insights
Data alone is slop; you need a framework to turn it into optimization moves. Here’s how the analysis should flow.
Correlation with Rankings
Run a regression analysis between micro‑interaction metrics and SERP positions. If hover time on a product spec correlates with a top‑3 rank, double‑down on that spec.
Segment by GEO and Device
One‑size‑fits‑all rarely works. Slice the data by country, language, and device type to uncover hidden GEO patterns. Mobile users might pause less but click through more, affecting your AEO score differently.
Schema Markup Integration
When you see a high‑performing micro‑interaction, embed schema markup that describes the element (e.g., FAQPage for accordion sections). Search engines then understand the context, amplifying the signal.
Optimization Playbook: Turning Signals into Rankings
Now that you’ve collected and analyzed, it’s time to optimize. Below is a pragmatic checklist that will make the engine notice you.
- Increase hover dwell time by adding richer tooltip content—think mini‑infographics, not just plain text.
- Design scroll‑triggered animations that pause the page for 2‑3 seconds, encouraging deeper engagement.
- Use contrast‑driven CTA buttons that generate higher click‑through confirmations.
- Implement progressive disclosure in forms: show one field at a time to boost interaction counts.
- Apply schema markup to every micro‑interaction element so the engine can index the signal directly.
Pros and Cons of Heavy Micro‑Interaction Optimization
Every tactic has trade‑offs. Consider the following before you go all‑in.
| Pros | Cons |
|---|---|
| Higher AEO relevance scores | Potential page‑load slowdown if over‑animated |
| Better user experience (UX) metrics | Increased development overhead |
| More granular GEO targeting | Risk of over‑tracking privacy‑sensitive users |
Real‑World Case Study: E‑Commerce Site Boosts Rankings with Micro‑Interactions
One mid‑size retailer decided to audit their product pages for micro‑interaction signals. They added hover tooltips to size guides, scroll‑triggered “You may also like” carousels, and a one‑click “Add to Wishlist” modal.
After 90 days, they saw a 27% increase in average hover time, a 15% rise in scroll‑pause ratio, and a 12% lift in click‑through confirmations. Their AEO ranking for “summer sandals” jumped from page 3 to page 1, shaving off $45K in paid search spend.
The secret? They paired the signals with Product schema markup and fed the cleaned data into an llm‑powered recommendation engine that personalized the carousel content per GEO.
Common Pitfalls and How to Avoid Them
Don’t fall for the “more is better” myth. Overloading a page with flashy micro‑interactions can backfire.
Pitfall #1: Ignoring Page Speed
If animations delay First Contentful Paint, the user bounces before any signal registers. Use lazy‑load and CSS‑only transitions whenever possible.
Pitfall #2: Collecting Too Much Data
Analytics slop overwhelms analysts. Stick to the five core signals outlined earlier, and discard noise.
Pitfall #3: Forgetting Privacy Regulations
EU GEO users demand consent for tracking. Implement a clear opt‑in flow; otherwise you’ll lose trust and rankings.
Future Trends: LLM‑Driven Signal Interpretation
Large language models (llm) are already reshaping SEO content creation, but they’re also getting smarter about user behavior. In the next few years, llms will auto‑tag micro‑interaction data, predict which signals will lift AEO scores, and even suggest schema markup on the fly.
One early adopter integrated an llm into their analytics pipeline; the model flagged “low‑hover” sections and recommended copy tweaks that increased dwell time by 8% without any manual A/B testing.
Bottom Line: Crush the Competition with Micro‑Interaction Mastery
If you keep ignoring these tiny UX signals, you’ll stay buried while others dominate the answer engine. The data isn’t slop; it’s a cheat code.
Track, analyze, and optimize the AEO micro‑interaction signals, and watch your rankings soar. One final thought: the game is rigged, but the rules are public. Use the playbook above, stay ruthless about results, and you’ll turn those micro‑moments into macro victories.
Frequently Asked Questions
What are AEO micro‑interaction signals?
They are tiny user gestures—like hovering, scrolling, or pausing on tooltips—that search engines track as indicators of content relevance and user satisfaction.
How does hover and tooltip engagement influence AEO rankings?
Longer hover times signal that users need clarification, which search engines interpret as higher content usefulness, potentially boosting the page’s AEO score.
What are the four main families of micro‑interaction signals used in AEO?
Hover & tooltip engagement, scroll depth & fraction, click & tap patterns, and pause or dwell time on UI elements such as accordions or modals.
How can I measure micro‑interaction signals with my analytics stack?
Implement event tracking for hover duration, scroll percentages, click counts, and dwell time using tools like Google Analytics, GTM, or specialized UX analytics platforms.
Why do tiny user gestures matter more than backlinks in AEO?
Micro‑interactions provide real‑time, behavior‑based evidence of user satisfaction, which modern Answer Engine algorithms prioritize over static link signals.